Welcome to “Noise & Chatter” volume six (VI). Noise & Chatter is a random column we (plan to) periodically pull together to address issues that come up around the water cooler. Sometimes what folks hear on TV, or read online, is news-worthy. But sometimes this information may not necessarily true (or even accurate). Nevertheless, it often gets quoted and repeated like lines from the Book of Psalms.
So, from time to time, we’ll address some points we hear out there in wild, and bring them to our readership. Think of these (ultra-)infrequent columns as “Snopes for Investing.”
Let’s start with one we’ve heard frequently:
“The market has gone straight up since Trump got in office.
But we’re not making…(any money)…” (expletive deleted)
Noise & Chatter replies:
Hmmm. Is that true? Let’s take a look.
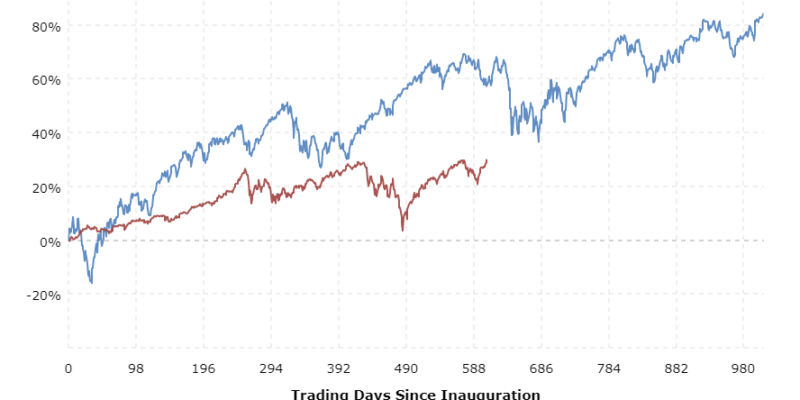
To keep things apples and apples, let’s look at the Standard & Poor’s 500 Index (SPX), even though the “S&P” may not be typical of many investors accounts. But the S&P is a well-known yardstick. And since Trump was inaugurated (as of this writing, 610 days ago), the S&P 500 Index is, indeed, up approximately 30.1%.
Wow, that seems terrific, right?
Historically speaking, you would be right. These gains are something to write home about.
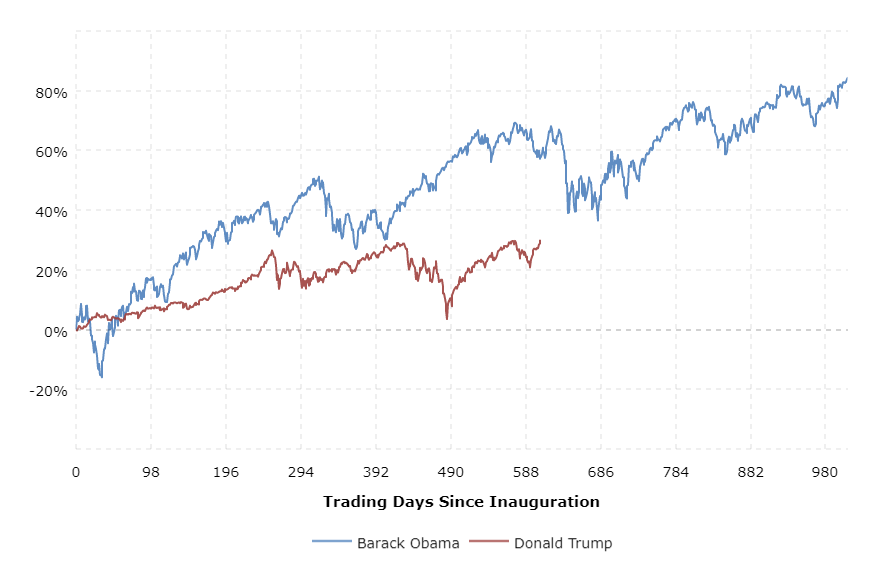 That is, until you compare it to the returns generated during the previous administration (President Obama). Through the first 610 days of the Obama administration, the S&P 500 Index was up +60.9%.
Now admittedly, the Obama administration benefited from spectacular timing. 2008 was a disaster and we can’t put lipstick on that pig to dress it up. On top of that, the S&P 500 Index went through a terrible draw-down (first quarter 2009) in their first thirty-one market days of their administration. Then the S&P 500 Index rebounded and did extremely well the balance of 2009. Timing in life is everything.
Sidebar: we wonder how many folks actually got back INTO the markets in early 2009.
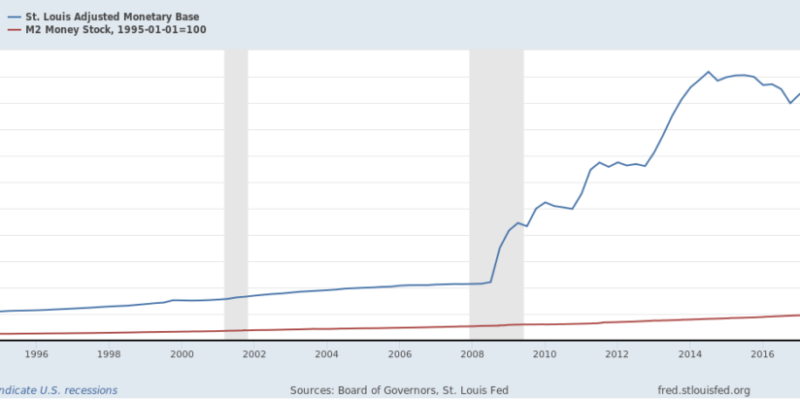
And thanks to our friends at MacroTrends, we can present these images.
But back to the narrative, “this market has gone straight up since Trump got in office!”
Like Roger Clemens, it’s amazing how some folks (many folks?) can “misremember” details or events. Not that we’re trying to decipher people’s memories, but the market indeed had a very good run immediately after the election in November 2016. Trump was then inaugurated in January 2017. And 2017 happened to be a slow steady climb – with record low volatility (some would argue NO volatility).
There is no doubt the market has generated a positive return while Trump has been in office. There is no dispute about that. But the “feeling” that the “market has gone straight up since Trump got in office” seems (and feels) inaccurate.
Lost in the fog has been the “trip” known as 2018 in markets. And what a ride it was!
Let’s look at the Dow Jones Industrial Average:
- Ended 2017 (12/29/17) at 24,719
- Reached 26,616 on January 26, 2018 (up 7.67%)
- Fell to 23,533 on March 23, 2018 (from the peak 1/16/18, down 11.58%, YTD down 4.79%)
- Reached 26,828 on October 3rd, 2018 (from the 3/23/18 low, up 14%, YTD up 8.53%)
- Fell to 21,792 on December 24, 2018 (from the 10/3/18 high, down 18.77%, YTD down 11.8%)
See the chart (below) for a graphical image of the roller-coaster ride for the Dow Jones in 2018.
And this actually ties in nicely with the next point that “Noise & Chatter” would like to address.

Take a closer look at this chart. We heard recently from an observer they “haven’t made any money in a year and a half.”
OK, it was not said precisely that way. Technically, he said “I haven’t made any … (expletive deleted) …money in a year and a half.”
Isn’t this interesting? Look again at the chart and you will see:
- The Dow Jones peaking in January 2018 above 26,000, then falling back.
- The Dow Jones peaking in October 2018 (again) above 26,000, then falling back.
- The Dow Jones peaking in April 2019 (again) above 26,000, then falling back.
- The Dow Jones peaking (now) in June 2019 (again) above 26,000.
Like the S&P 500 Index, the Dow does not truly represent too many portfolios out there, but remains a widely recognized yardstick. Will this be a new ceiling in the Dow Jones Industrial Average, or a new base to move higher from? We won’t make a prediction, only time will tell. But the Dow Jones seems to be meeting resistance at these levels. And a break-through from these levels will put the DJIA on a technical buy signal and in new territory.
This additional information (tracking the roller coaster ride for the Dow Jones in 2018) ties in nicely with a tweet posted just the other day:
(It “feels” to some) the market *has* been ripping higher. But – for how long? The calendar 2019 returns (as of the date this was written 6/21/19) are positive. However, if Noise & Chatter had written this post a month ago, the returns were close to being negative year to date. And what about the last (trailing) twelve months?
Well, take a look:
https://twitter.com/TomMullooly/status/1141385143212478464
That’s right. The last twelve months (essentially June 2018 through May 2019) the returns were practically nothing. It really depends where the lines are drawn.
As we wrap up this sixth edition of “Noise & Chatter” we always remind our dear readers to look it up or check it out before taking some information as rock-solid truth.